BlinkIT - Grocery Analysis in Excel
To conduct a comprehensive analysis of Blinkit's sales to identify key insights using various KPIs and visualizations in Excel.
Preview
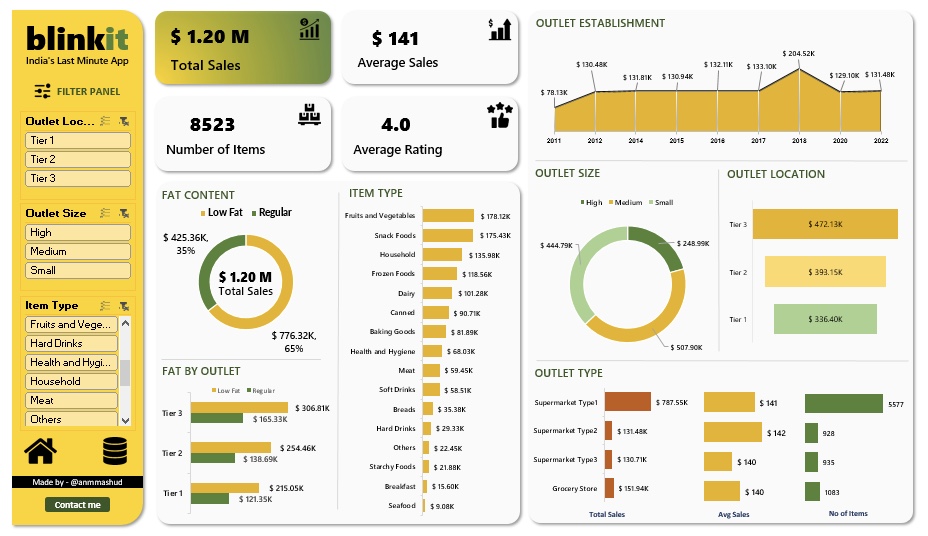
Business Requirements:
To conduct a comprehensive analysis of Blinkit’s sales performance, customer satisfaction, and inventory distribution to identify key insights and opportunities for optimization using various KPIs and visualizations in Excel.
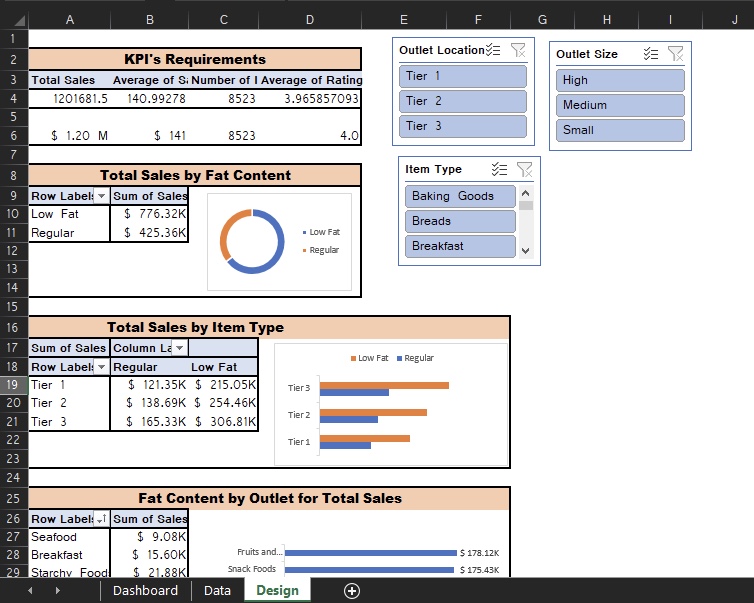
KPI’s Requirements
- Total Sales: The overall revenue generated from all items sold.
- Average Sales: The
average revenueper sale. - Number of Items: The total count of different items sold.
- Average Rating: The average customer rating for items sold.
Chart Requirements
- Total Sales by Fat Content:
- Objective: Analyze the impact of
fat contentontotal sales. - Additional KPI Metrics: Assess how other KPIs (Average Sales, Number of Items, Average Ratings) vary with fat content.
- Chart Type:
Donut Chart
- Objective: Analyze the impact of
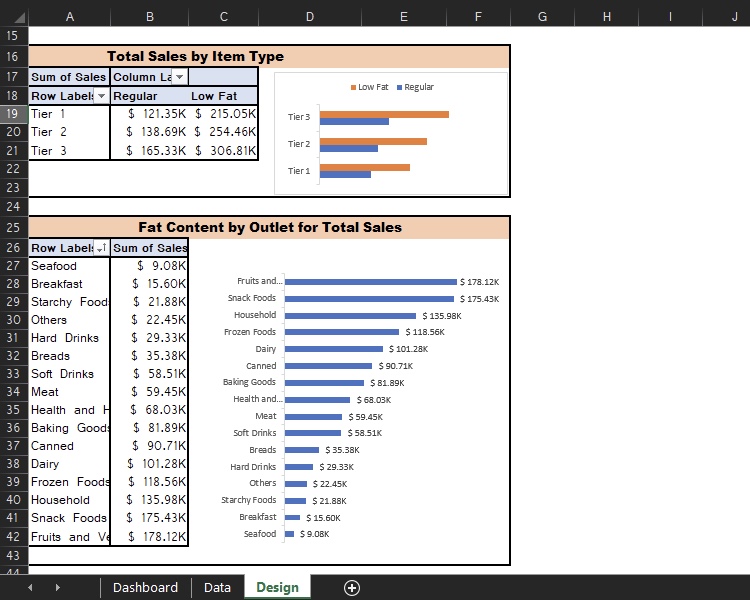
- Total Sales by Item Type:
- Objective: Identify the performance of different items in terms of
total sales. - Additional KPI Metrics: Assess how other KPIs (Average Sales, Number of Items, Average Ratings) vary with item type.
- Chart Type:
Bar Chart
- Objective: Identify the performance of different items in terms of
- Fat Content by Outlet for Total Sales:
- Objective: Compare
total salesacross different outlets segmented by fat content. - Additional KPI Metrics: Assess how other KPIs (Average Sales, Number of Items, Average Ratings) vary with fat content.
- Chart Type:
Stacked Column Chart
- Objective: Compare
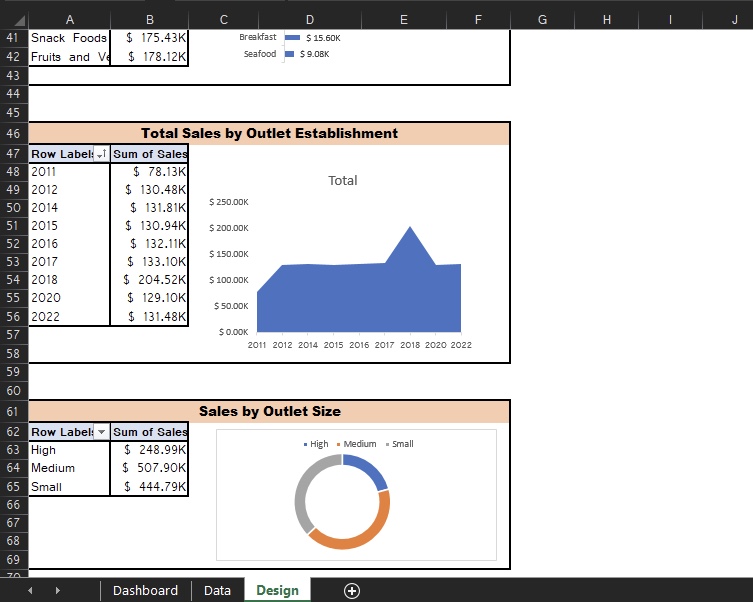
- Total Sales by Outlet Establishment:
- Objective: Evaluate how the
ageortypeof outlet establishment influencessales. - Chart Type:
Line Chart
- Objective: Evaluate how the
- Sales by Outlet Size:
- Objective: Analyze the correlation between
outlet sizeandtotal sales. - Chart Type:
Donut/Pie Chart
- Objective: Analyze the correlation between
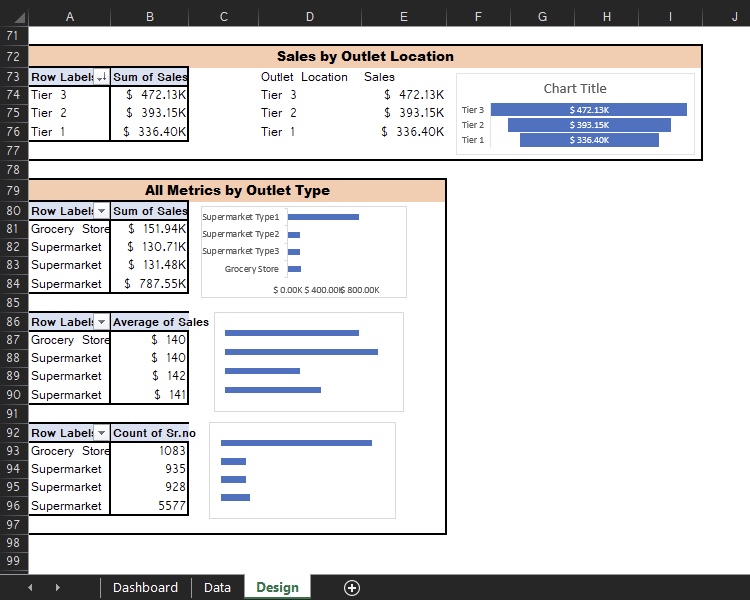
- Sales by Outlet Location:
- Objective: Assess the geographic distribution of
salesacross differentlocations. - Chart Type:
Funnel Map
- Objective: Assess the geographic distribution of
- All Metrics by Outlet Type:
- Objective: Provide a comprehensive view of all key metrics (Total Sales, Average Sales, Number of Items, Average Rating) broken down by different outlet types.
- Chart Type:
Matrix Card
Additional Resources
- 📂 BlinkIT-Grocery-Data-Excel.xlsx – A dashboard in Excel file to explore the insights derived from the analysis.
-
📂 BlinkIT-Grocery-Data-Excel-Original.xlsx – The raw dataset in Excel format for your hands-on practice.
- 🎥 Project Video – A step-by-step video walkthrough of the analysis process on YouTube.
- 📊 Dataset – Access the dataset conveniently on Google Drive.
- 🌐 Tutor’s Website – Learn more and explore tutorials from the instructor on Topmate.io.
Instructions
The downloads above include both the dashboard and raw dataset files for the BlinkIT Grocery Data Analysis project. Use the dashboard file to explore the final visualizations, and the raw dataset file for replicating the analysis yourself. Don’t forget to check out the video tutorial and additional resources to enhance your understanding.
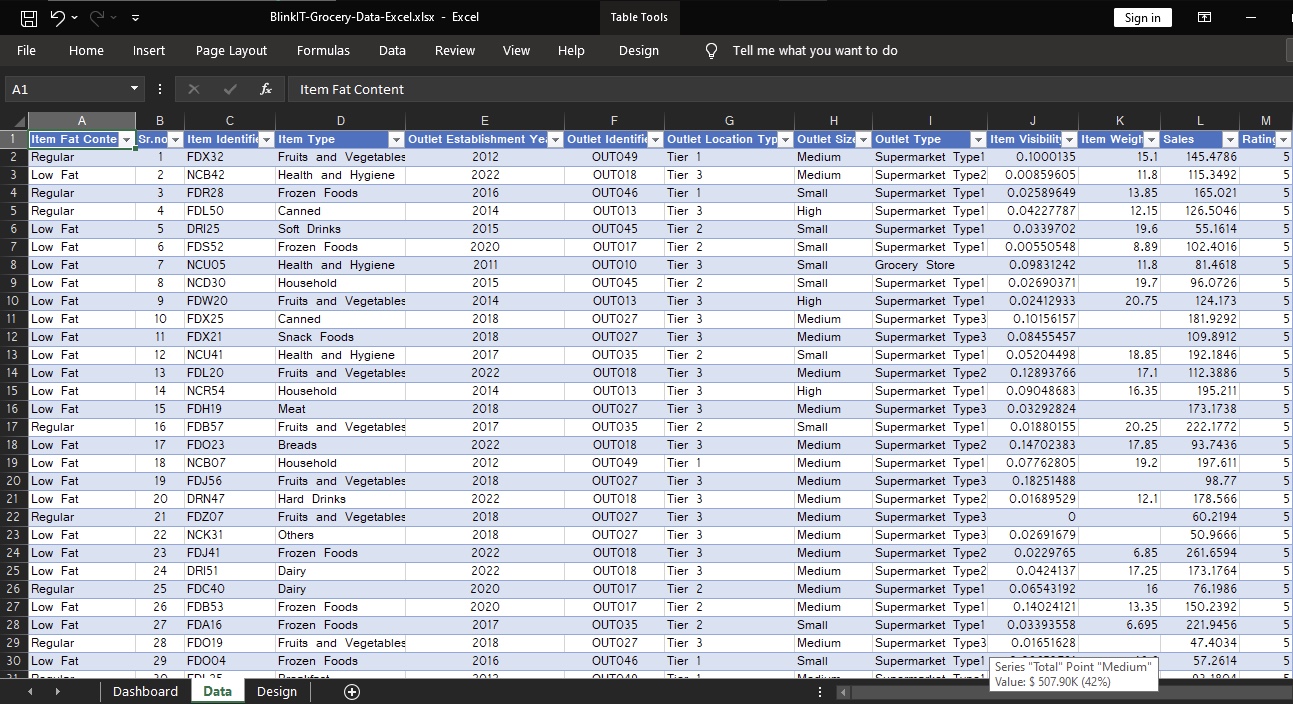
Data Snapshots
Here are examples of raw data and processed outputs:
Data Overview
Pivot Table Snapshots
