Vrinda Store - Data Analysis in Excel
This project involves analyzing sales data for Vrinda Store from 2022.

🎯 Objective:
The goal is to generate an annual 📊 report that highlights performance metrics for 2022, providing insights into customer trends 🔎 and helping develop strategies to improve sales in 2023.
🔮 Roadmap:
- 📚 Collecting Data
- ❓ Sample Questions
- 🧰 Data Cleaning
- ⚙️ Data Processing
- 🔝 Data Analysis
- 🎨 Creating Dashboard
- 🔦 Insights
- 🌐 Next Steps
📚 Collecting Data:
The dataset was provided in the file Vrinda_Store_original.xlsx
❓ Sample Questions:
Here are some questions to guide the analysis:
- 📈 How do sales compare to orders in a single chart?
- 🌄 Which month had the highest 📈 sales and orders?
- 💃 Did men or women purchase more in 2022?
- 🔎 What were the different order statuses in 2022?
- 🌎 Which 10 states contributed the most to sales?
- 🌀 How are age ⏳ and gender 👩👨 related to order numbers?
- 🌐 Which sales channel contributed the most revenue?
- 🎪 Which category had the highest 💸 sales?
🧰 Data Cleaning:
-
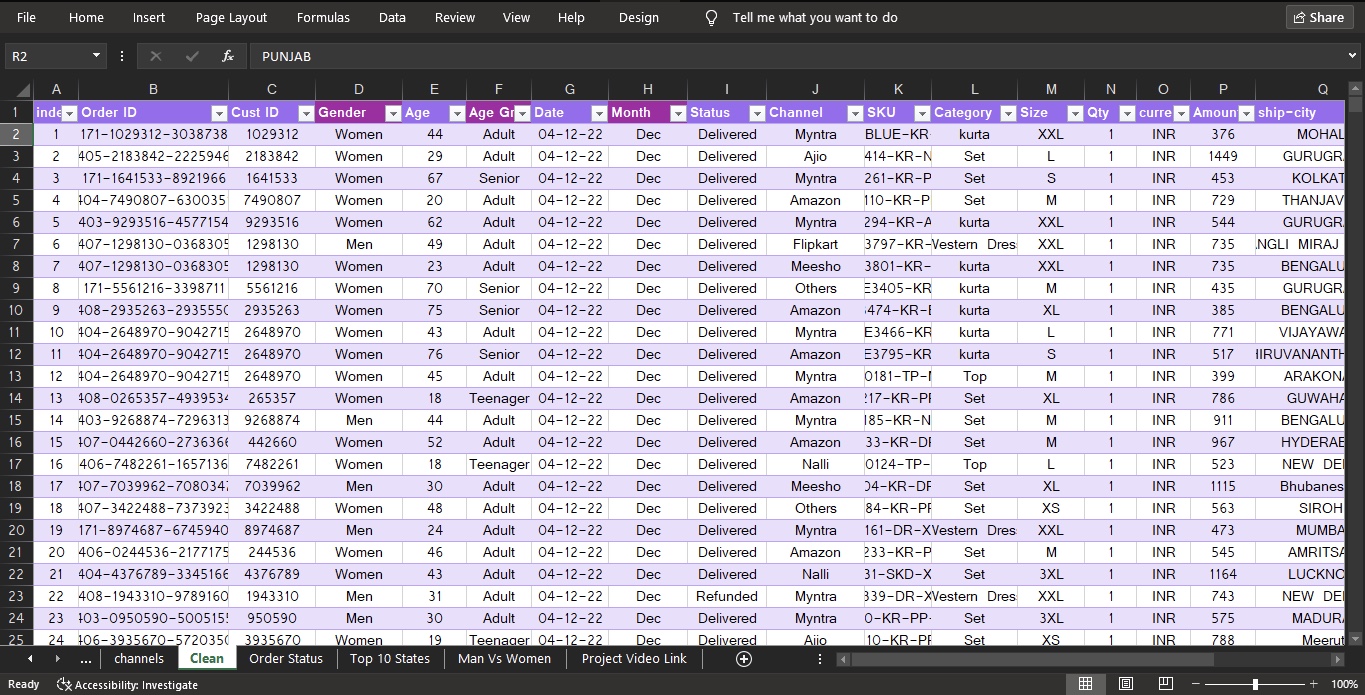
🔢 Transforming the data into a table: The data was turned into a table to enable filters and make it easier to analyze. (You can also activate filters using Alt + D + F, but tables are more reliable.)
-
🧠 Checking for anomalies: I checked for blank or null cells. Luckily, none were found. If there were any, they would have been ❇ excluded using the filter options.
-
🏛️ Standardizing gender entries: The gender column had inconsistent entries (Men, M, W, Women). These were standardized into two categories: Men and Women.

⚙️ Data Processing:
To address trends over time, a new column was added to extract the 🔢 month from the Date column.
🔝 Data Analysis:
Analysis steps include the use of 📈 charts, pivot tables, and calculations to answer the questions and uncover trends. ✨✨✨
🎨 Creating Dashboard:
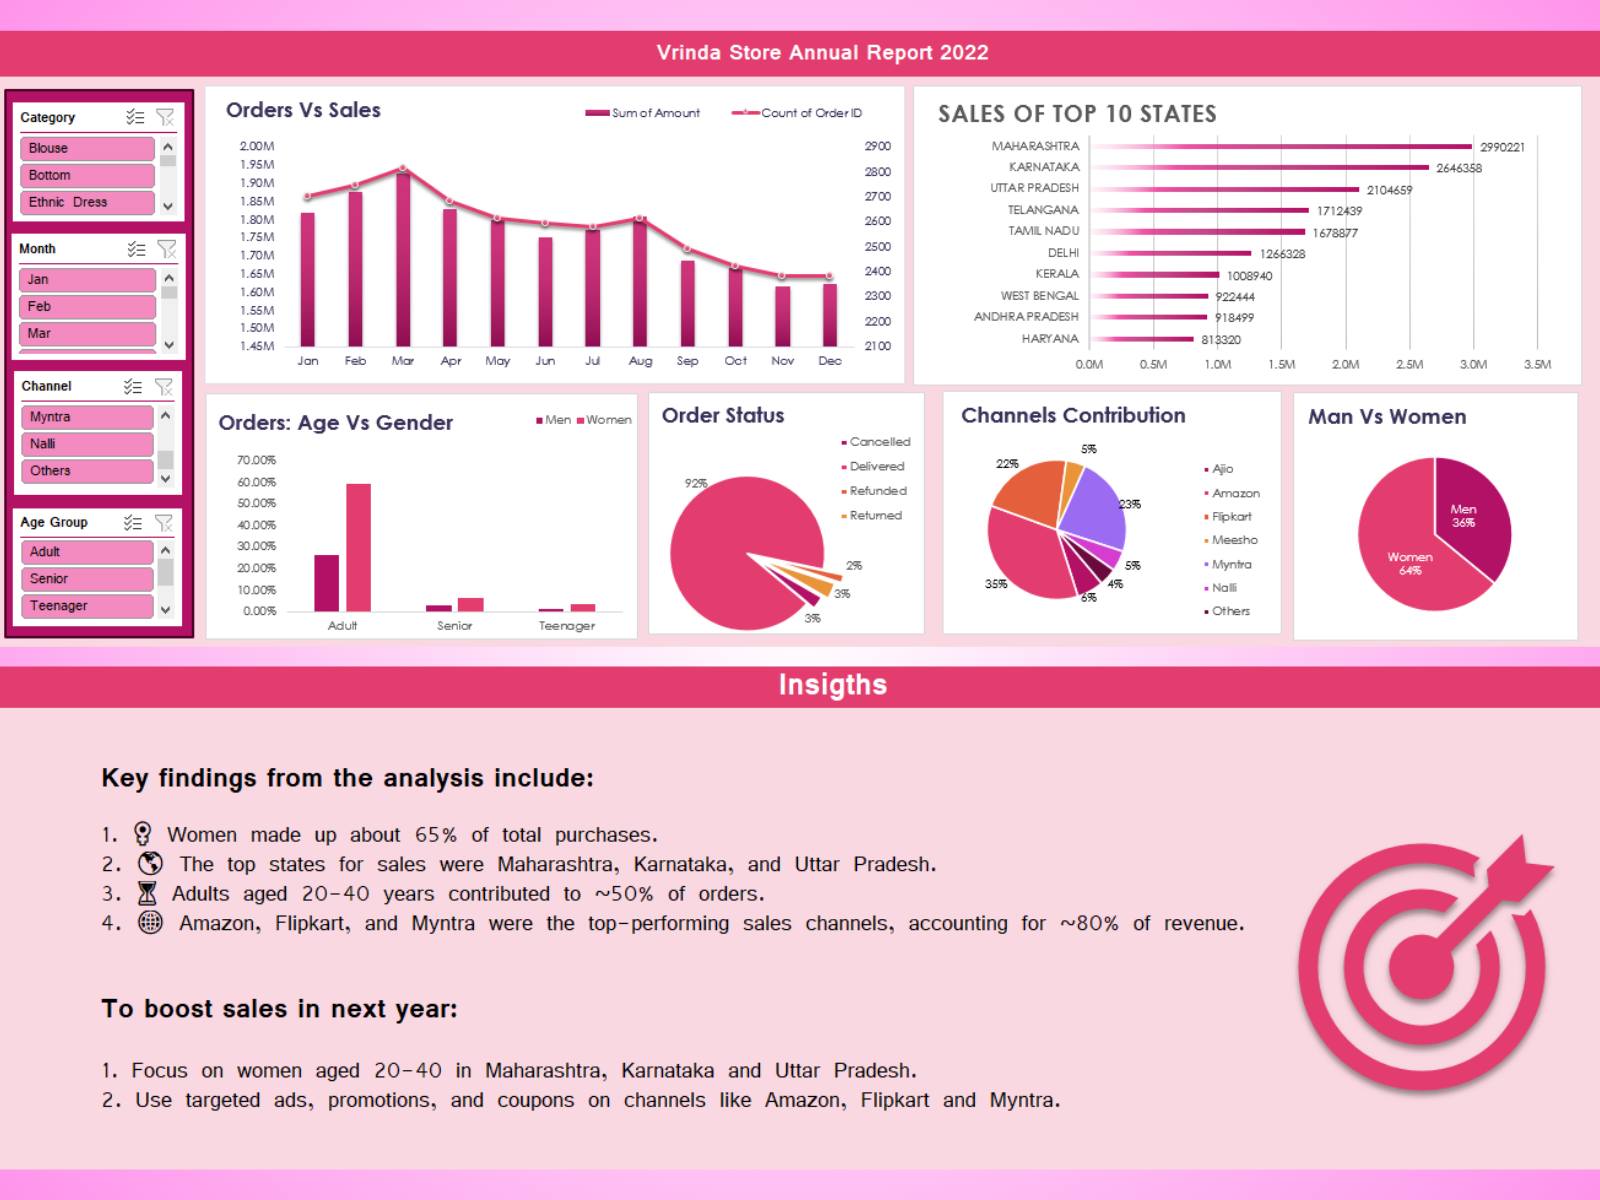
The dashboard includes:
- 📈 Bar Charts:
- Orders vs. Sales
- Top 10 States by Sales
- Age vs. Gender Orders
- 🔹 Pie Charts:
- Order Status
- Channel Contribution
- Gender Comparison (Men vs. Women)
- 🔂 Slicers:
- 🎪 Category
- 🌄 Months
- 🌐 Channel
- 🔢 Age Group

🔦 Insights:
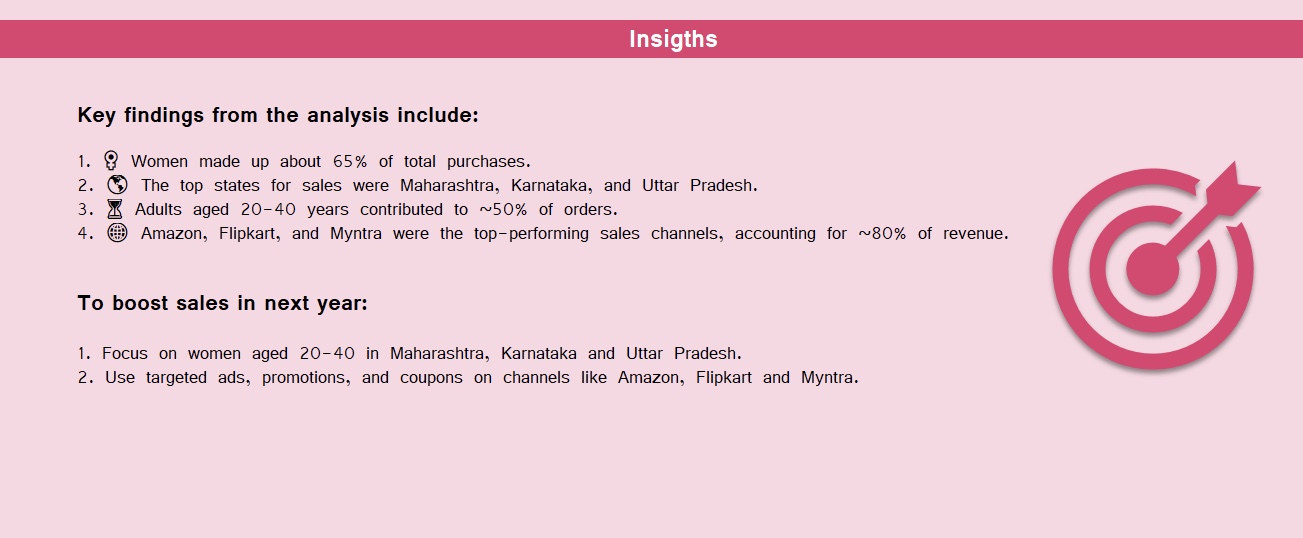
Key findings from the analysis include:
- ♀️ Women made up about 65% of total purchases.
- 🌎 The top states for sales were Maharashtra, Karnataka, and Uttar Pradesh.
- ⏳ Adults aged 20-40 years contributed to ~50% of orders.
- 🌐 Amazon, Flipkart, and Myntra were the top-performing sales channels, accounting for ~80% of revenue.
✅ Recommendations:
To boost sales in 2023:
- Focus on ♀️ women aged 20-40 in 🌎 Maharashtra, Karnataka, and Uttar Pradesh.
- Use 📲 targeted ads, 🎉 promotions, and 🎁 coupons on channels like Amazon, Flipkart, and Myntra.

📥 Downloads:
🌍 Resources:
🙏 Special Thanks:
- Rishab Mishra for his guidance 🤝 and for providing valuable resources. ✨
🔗 Useful Links:
- GitHub – Explore related projects and 🔎 resources.
- YouTube Channel – Tutorials 🔄 and additional learning materials by Rishab Mishra. ✨✨✨
🎥 Project Course:
- Project Course on YouTube – A detailed course explaining project development ⚙️ and analysis techniques. ✨✨✨